


In this guide: retail stock allocation software explained end to end — what it does, the features that matter, and how to roll it out in your stores.
the allocation engine solves the problem that buying well cannot: even a perfect purchase is wasted if the units land in the wrong stores. Allocation decides where every unit goes — by store demand curves, size-level history, and warehouse-to-store logic — so the same buy sells through instead of splitting into stockouts here and markdowns there.
This guide explains how modern allocation works, when to push and when to pull, and what a well-run allocation program changes in the first quarter.
The Allocation Problem: Same Chain, Different Demand
Two stores of the same banner, ten kilometres apart, can behave like different planets: different sizes, colours, footfall patterns, and returns. Flat “send 10 units everywhere” allocation ignores that reality — which is why chains routinely report 60%+ of SKUs simultaneously overstocked somewhere and out-of-stock elsewhere.
the allocator replaces the flat split with per-store demand models. Each store receives stock in proportion to what it will actually sell — and keeps receiving it as the season unfolds.
How Retail Stock Allocation Software Decides Where Stock Goes
The decision engine blends several signals into one recommendation per SKU per store:
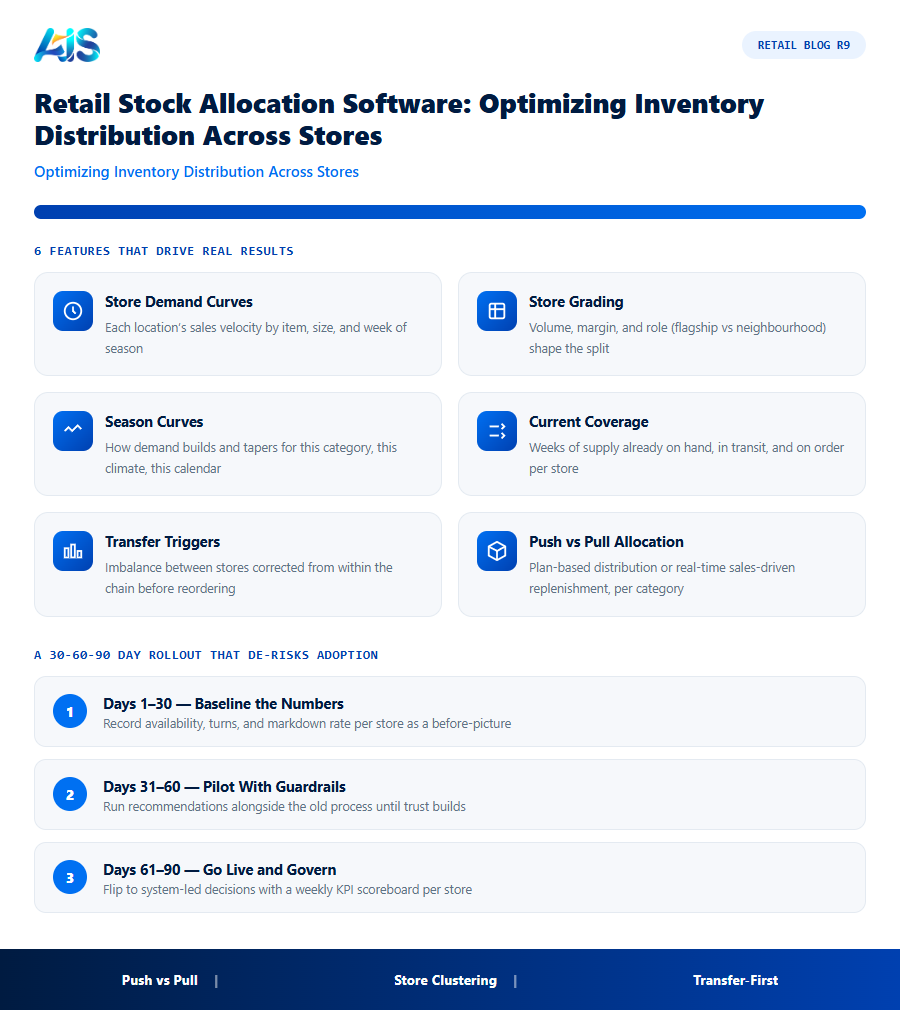
- Store demand curves — each location’s sales velocity by item, size, and week of season.
- Store grading — volume, margin, and role (flagship vs neighbourhood) shape the split.
- Season curves — how demand builds and tapers for this category, this climate, this calendar.
- Current coverage — weeks of supply already on hand, in transit, and on order per store.
- Transfer triggers — imbalance between stores is corrected from within the chain before reordering.
The output is not a report — it is a pick list. Allocation suggestions arrive as approved-ready moves in the ERP, so warehouse teams act the same day.
Push vs Pull Allocation: When Each Wins
Mature retail allocation programs run both modes deliberately:
| Push allocation | Pull allocation | |
|---|---|---|
| Best for | Launches, seasonal sets, promotions | Replenishable basics, continuity items |
| Trigger | Season calendar, campaign plan | Store-level reorder points |
| Split logic | Forecasted store-level demand | Actual velocity + coverage weeks |
| Risk | Overstocks if the forecast misses | Stockouts if triggers lag demand |
| Control | Central merchandising team | Store or cluster managers |
Most chains push newness for the first two to four weeks, then switch those SKUs to pull. The software handles the switchover — merchandisers set policy, not spreadsheets.
Allocation in Action: A 25-Store Example
A 25-store footwear chain launches a new trainer line with 3,000 pairs. The old flat split sent 120 pairs everywhere; the two tourist stores sold out in nine days while six suburban stores sat on half their allotment for a month. Under allocation software, the launch split follows each store’s size-level demand curve — 260 pairs to the tourist cluster, 70 to slow suburban sites — and week-two transfers rebalance automatically from sell-through signals.
The result is the allocation dividend: higher full-price sell-through, fewer emergency transfers, and a second buy placed with evidence instead of hope. That is what the allocator buys you — the same purchase order, simply spent where demand actually lives.
Industry research from the National Retail Federation regularly highlights allocation accuracy as a driver of full-price sell-through.
These allocation rules run inside Retail Pro AI and multi-branch retail distribution..
How the Investment Pays for Itself
The business case for the allocation engine is unusually straightforward because the costs of the status quo are visible every single week — in markdowns, rush orders, overtime, and write-offs. Put numbers on those leaks and the software starts paying for itself.
Then look at working capital. Inventory is usually a retailer’s largest use of cash after property, so a ten to fifteen percent reduction in average holdings — a realistic outcome once the allocator is running — releases funds that can pay down debt or fund new ranges. Labour is the third lever: buyers, planners, and store managers reclaim hours previously lost to spreadsheets, stock counts, and expediting.
There is also a compounding effect that spreadsheets understate. Cleaner stock data improves every downstream decision: forecasts get sharper, suppliers perform better against reliable orders, and store teams stop firefighting. Each quarter the system runs, the recommendations get more precise because they learn from more history — the return grows while the subscription cost stays flat.
A 30-60-90 Day Rollout That De-risks Adoption
The safest way to adopt retail stock allocation software is in waves: prove it in a few stores, harden the process, then scale. A 30-60-90 day plan keeps momentum while giving every stakeholder an early win.
Training is lighter than most teams fear. Store champions need a single hands-on session plus a one-page crib sheet; buyers and planners need half a day on approvals, exceptions, and tuning. Because daily work happens through familiar screens and plain-language alerts, adoption rarely becomes the bottleneck.
- Days 1-30 — baseline the numbers: record availability, turns, and markdown rate per store so the allocator has a before-picture to beat.
- Days 31-60 — pilot with guardrails: run system recommendations alongside the old process, overriding only with a logged reason, until trust builds.
- Days 61-90 — go live and govern: flip to system-led decisions, review exceptions weekly, and publish a visible KPI scoreboard per store.
Stock Allocation Models: Push vs. Pull
Retail stock allocation software generally works on one of two underlying models, and choosing the right one for each category matters as much as choosing the software itself.
- Push allocation — stock is distributed to stores based on a plan set before the selling season starts, often using historical performance tiers. This suits new product launches and fashion ranges where there is no in-season sales history yet to react to.
- Pull allocation — stock moves to stores based on actual, real-time sales as they happen, replenishing what is selling rather than following a fixed plan. This suits staple, year-round products where demand is more predictable and reactive fulfillment outperforms a rigid plan.
Most multi-store retailers need both models running side by side: push for new lines and seasonal launches, pull for core replenishment items. Retail stock allocation software that only supports one model forces a compromise — either over-planning staple items that should react to real demand, or under-planning new launches that have no sales history to pull from yet. When evaluating a platform, ask specifically how it handles the transition from push to pull as a new product accumulates a few weeks of sales history, since that handoff is where many allocation tools fall short.
Store Clustering: The Foundation Most Allocation Programs Skip
Retail stock allocation software works best when stores are first grouped into clusters that behave similarly, rather than treating every location as a unique demand curve to model from scratch or, at the other extreme, as one chain-wide average. Clustering groups stores by shared characteristics — climate, demographic profile, store format, urban versus suburban footfall — so a new store with little sales history can still receive an informed allocation by borrowing the pattern of its cluster, rather than defaulting to a flat chain-wide split.
A common mistake is clustering stores purely by sales volume, which groups a high-volume tourist location with a high-volume commuter hub even though their actual product mix needs are completely different. Better allocation software clusters on the shape of demand — which categories, sizes, and price points sell — not just the size of it. A tourist store and a commuter hub can move similar total revenue while needing almost opposite size curves and category mixes.
Retailers should expect to revisit clustering periodically, not set it once and forget it. A store’s catchment can shift — a new competitor opens nearby, a transit line changes footfall patterns, a neighborhood’s demographics evolve — and allocation logic built on an outdated cluster assignment will quietly misallocate stock until someone notices the pattern in the sell-through data.
Handling Allocation for New Stores With No Sales History
A new store opening is the hardest case for any allocation model, because there is no historical demand curve to allocate against yet. Retail stock allocation software handles this gap in one of two ways, and the choice matters for how quickly a new location reaches full-price sell-through:
- Cluster-based proxy allocation — the new store inherits the demand curve of its assigned cluster (see above) until it accumulates enough of its own sales history, typically four to eight weeks, to blend in real data gradually.
- Comparable-store matching — the software identifies the single most similar existing store, based on size, location type, and format, and mirrors that store’s opening-period allocation exactly, adjusting only once real sales data starts to diverge from the match.
Retailers opening several stores a year should confirm during evaluation which approach a platform uses, and how quickly it transitions a new store from proxy data to its own actual sales — a slow transition means weeks of avoidable overstock or stockouts at exactly the moment a new location is trying to build a reputation with local customers.
Retail stock allocation software: Frequently Asked Questions
What does retail stock allocation software do?
It decides which stores receive which stock, and when — using per-store demand models, season curves, and live coverage data — then turns those decisions into ERP-ready pick lists and transfers.
How is allocation different from replenishment?
Allocation distributes a fixed pool of stock (launches, seasonal buys); replenishment reorders new stock as stores sell. Most retailers run both: allocate the launch, replenish the base.
Does allocation software work with SAP Business One?
Yes — solutions like Retail Pro AI read SAP Business One stock, sales, and purchase data directly, so allocation decisions execute inside the ERP your team already runs.
What data do we need before starting with retail stock allocation software?
Clean item masters, accurate opening stock per location, supplier lead times, and at least six months of sales history. Most retailers already hold all four inside their POS and ERP — the implementation work is validation and deduplication, typically completed inside the first month.
Can small retail chains afford this kind of platform?
Yes. Cloud pricing scales with stores and users, so a five-store chain pays a fraction of what an enterprise deployment costs. Because the savings come from the same leaks — stockouts, markdowns, overstock — smaller chains often see faster payback in percentage terms.
Does this kind of platform replace our buyers and planners?
No — it upgrades them. the platform handles the repetitive arithmetic of forecasting and ordering so buyers can negotiate better terms, planners can shape ranges, and store teams can serve customers. Headcount rarely falls; output per head rises sharply.
the allocator turns distribution from a flat guess into a per-store science: demand curves decide the split, transfers fix imbalance from within, and every unit lands where it sells. Push newness with forecasts, pull basics with triggers — and measure the dividend in full-price sell-through within your first quarter. The technology is proven, the payback is measurable, and the risk of a small pilot is minimal. What remains is simply the decision to let the allocator start earning its keep in your stores. See how Retail Pro AI brings retail stock allocation software together with AI inside SAP Business One — book a demo to see your own store data in action.
