


In this guide: retail business intelligence software explained end to end — what it does, the features that matter, and how to roll it out in your stores.
the BI platform exists to answer one question fast: what should we do next? Your POS, ERP, e-commerce, and loyalty platforms already record the answer — in millions of rows no human can read. BI software for retail compresses those rows into the handful of numbers and explanations that change Monday’s decisions.
This guide covers the KPIs that matter, how modern AI changes the reporting game, and how to choose a BI layer that stays in sync with your ERP instead of drifting into another stale spreadsheet.
Why Retail Data Silos Kill Good Decisions
In most chains, sales live in the POS, stock in the ERP, e-commerce in its own console, and loyalty in a fourth system. Each team answers the same question differently, and every meeting starts with an argument about whose number is right. The cost is not the meeting — it is the markdown ordered on bad data and the replenishment that never fired.
the solution fixes the foundation first: one semantic layer where sales, stock, margin, and customer metrics share definitions. When the numbers agree, decisions get fast — and the argument moves to strategy, where it belongs.
What Retail Business Intelligence Software Actually Does
A useful retail BI layer does three jobs:
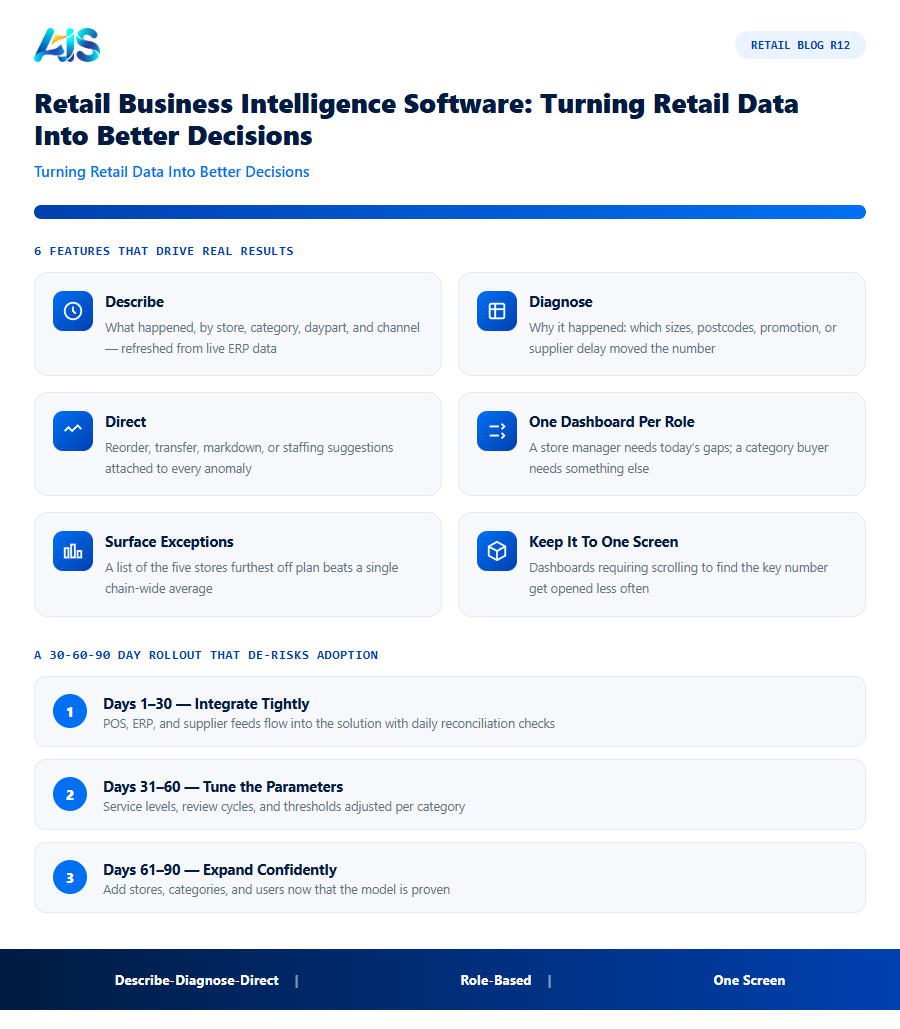
- Describe — what happened, by store, category, daypart, and channel, refreshed from live ERP data rather than Friday’s export.
- Diagnose — why it happened: which sizes, which postcodes, which promotion, which supplier delay moved the number.
- Direct — what to do next: reorder, transfer, markdown, or staffing suggestions attached to every anomaly.
Modern platforms add a conversational layer on top: ask “why did category margin drop in the north stores?” and get a chart plus the drivers, in seconds. That is the difference between a report and an answer.
The KPIs Every Retail BI Dashboard Needs
Tooling varies, but the questions are constant. A retail BI dashboard earns its keep when it answers these at a glance:
| KPI | The question it answers | Review cadence |
|---|---|---|
| Sell-through rate | Is stock moving or sitting? | Weekly |
| GMROI | Is inventory investment paying? | Monthly |
| Stockout rate | How often did demand go unserved? | Weekly |
| Basket size & UPT | Are customers buying more per visit? | Weekly |
| Markdown % | How much margin did slow stock cost? | Monthly |
| Shrinkage | Where is stock leaking? | Monthly |
Track these on shared definitions and the “which number is right” debate disappears — the the solution becomes the scoreboard everyone plays to.
Choosing a Retail BI Layer That Stays in Sync
Three checks separate durable BI from demo-ware. First, ERP-native data: the BI layer should read your ERP transactions directly, so finance and operations see the same truth. Second, per-store granularity: chain averages hide the store-level signals that drive action. Third, AI that explains: look for natural-language questions, anomaly detection, and daily briefings — not just static charts.
Retail Pro AI combines all three with SAP Business One: conversational analytics, forecast-driven dashboards, and one shared metric layer for every store. Evaluate any vendor with your own last quarter of data — the tool that explains it best is the one your team will actually use.
For a broader look at self-service analytics patterns, Tableau on retail analytics is a useful vendor-neutral reference.
The same live-data pattern powers warehouse-to-finance insights..
How the Investment Pays for Itself
Boards do not buy software, they buy outcomes. For the BI platform, the outcomes that matter are fewer stockouts, leaner inventory, and calmer teams — each of which can be quantified before you commit a single dollar.
A sensible target is full payback inside twelve months on a like-for-like store group. Most of our clients hit it sooner, because the solution attacks several cost lines simultaneously rather than optimising one metric in isolation. Finance can verify every claim from the POS and the general ledger — no faith required.
Finally, weigh the cost of delay. Each season run on gut feel locks in another cycle of markdowns and missed sales that no later efficiency can recover. Pilots are cheap, reversible, and fast — the greater risk is spending another year with the same blind spots while competitors systematise their advantage.
A 30-60-90 Day Rollout That De-risks Adoption
Treat the rollout of retail business intelligence software as a retail season, not an IT project: short, intense, and judged on numbers. The 30-60-90 rhythm below is the pattern our most successful deployments share.
Scale in cohorts, not all at once. Each wave of stores inherits tuned parameters and battle-tested training from the last, so effort per store falls as coverage grows. By the final cohort, cutover is a routine operation rather than a project — exactly how enterprise rollouts should feel.
- Days 1-30 — integrate tightly: POS, ERP, and supplier feeds flowing into the solution with reconciliation checks every morning.
- Days 31-60 — tune the parameters: service levels, review cycles, and thresholds adjusted per category until recommendations feel right.
- Days 61-90 — expand confidently: add stores, categories, and users now that the model is proven on real trading data.
Building a Retail BI Dashboard That People Actually Use
Retail business intelligence software fails to earn its keep when dashboards are built once and never opened again. A few practical rules separate dashboards that get used daily from ones that get ignored:
- Design one dashboard per role, not one dashboard for everyone — a store manager needs today’s sales and stock gaps; a category buyer needs sell-through and margin trends; a CFO needs cash and shrinkage. A single crowded dashboard serves none of them well.
- Default to the most recent, actionable period — a dashboard that opens on last quarter’s numbers gets checked less often than one that opens on this week’s exceptions.
- Surface exceptions, not just totals — a list of the five stores furthest off plan is more actionable than a single chain-wide average that hides where the problem actually is.
- Keep it to one screen — dashboards requiring scrolling or multiple tabs to find the key number get opened less often, no matter how good the underlying retail business intelligence software is.
The retailers who get the most value from business intelligence tools are rarely the ones with the most dashboards — they are the ones whose two or three core dashboards are opened every single day because they answer a real question quickly.
Self-Service BI vs. Governed BI: Choosing the Right Balance
Retail business intelligence software generally leans toward one of two philosophies, and picking the wrong one for your organization’s maturity causes real friction. Self-service BI hands every user the tools to build their own reports and slice data freely; governed BI restricts most users to a curated set of pre-built dashboards maintained by a central analytics team.
Fully self-service BI sounds appealing but often recreates the exact “whose number is right” problem BI was meant to solve — two managers building slightly different queries against the same underlying data can arrive at different answers to what looks like the same question, simply because one filtered out returns and the other did not. Fully governed BI avoids that trap but can bottleneck on the central team, with store managers waiting days for a report that a self-service tool would have produced instantly.
The practical answer for most mid-size retailers is a hybrid: a governed, centrally maintained set of core metrics with agreed definitions — the numbers used in board reporting and performance reviews — plus a self-service layer built on top of those same governed metrics for ad hoc exploration. This way a category manager can freely explore sell-through by supplier without risking a definitional mismatch, because the underlying “sell-through” calculation is fixed centrally regardless of how the data gets sliced.
What to Ask Before Trusting a New Dashboard
Not every dashboard deserves equal trust, especially in the first weeks after a new retail business intelligence software deployment. Before making a decision based on a new report, a quick sanity check saves embarrassment later:
- Does this number reconcile with finance’s numbers for the same period? A dashboard showing revenue that does not match the general ledger has a definitional bug somewhere, even if the difference looks small.
- What is explicitly included and excluded? “Sales” meaning gross sales before returns produces a very different number than “sales” meaning net of returns — both are legitimate metrics, but only if everyone knows which one they are looking at.
- How fresh is the data behind this specific dashboard? Not every report in a BI suite refreshes on the same schedule; a dashboard that looks real-time but actually updates nightly can mislead a same-day decision.
Retailers who build this quick verification habit into the first quarter after go-live catch definitional mismatches early, before a dashboard’s numbers get quoted in a board meeting and someone has to walk them back later.
Retail business intelligence software: Frequently Asked Questions
What is retail business intelligence software?
Software that consolidates retail data — sales, stock, margin, customers — into dashboards, KPIs, and AI-driven answers, so decisions rest on one shared, current version of the truth.
How is retail BI different from POS reports?
POS reports describe one system’s slice. Retail BI joins POS, ERP, and e-commerce data, standardises definitions, and adds diagnosis and suggestions — not just charts.
Do small chains need retail BI?
Yes — especially small chains. With fewer people per store, automated insight does the work an analyst would otherwise do, and cloud pricing makes it affordable at five stores.
How long until we see ROI from retail business intelligence software?
Dashboard and alert value appears in weeks; measurable KPI movement — availability up, markdowns down — typically shows within one quarter on pilot stores. Full payback inside twelve months is the benchmark to hold vendors to, and most well-run rollouts beat it.
How does this kind of platform integrate with SAP Business One?
Through a native connector, the platform reads items, warehouses, purchase orders, and sales history directly from SAP Business One and writes back approved transactions — no re-keying, no nightly batch files. Platforms such as Retail Pro AI are built specifically for this integration, so stock, purchasing, and finance stay in one consistent database.
How is this kind of platform different from our POS reports?
POS reports describe what already happened; the platform decides what should happen next. It forecasts demand, generates orders and transfers, flags exceptions, and explains its reasoning — moving teams from backward-looking reports to forward-looking decisions.
the solution turns the data you already generate into decisions you can defend: shared KPIs, per-store visibility, and AI that explains the why behind every number. Choose an ERP-native layer like Retail Pro AI, pilot it with last quarter’s data, and let the scoreboard — not the loudest opinion — run the chain. Start narrow, measure honestly, and scale what the numbers prove. That discipline, powered by the solution, turns inventory from your biggest risk into your most reliable advantage. See how Retail Pro AI brings retail business intelligence software together with AI inside SAP Business One — book a demo to see your own store data in action.
