


In this guide: retail analytics software explained end to end — what it does, the features that matter, and how to roll it out in your stores.
the analytics platform turns the data your stores already produce — every sale, return, basket, and stock movement — into clear answers about what to do next. Instead of exporting spreadsheets and hoping the formulas are right, managers open one dashboard and see performance by store, category, and daypart.
The payoff is speed. Decisions like markdown timing, staffing levels, and reorder quantities stop depending on who had time to build a report. This guide covers the reports that matter, the KPIs worth tracking, and how AI-powered retail analytics software — including SAP Business One connected through Retail Pro AI — makes insight a daily habit rather than a month-end project.
What Retail Analytics Software Does
the analytics platform sits on top of your transactional systems — POS, ERP, e-commerce — and answers business questions in business language. It aggregates transactions into metrics, compares them across time and locations, and highlights exceptions that need action.
Modern platforms go further with AI. Instead of only showing what happened, they explain why it happened and predict what is coming: which items will run short next week, which stores will miss target, and which promotions actually lift margin rather than just volume.
Essential Reports Every Retailer Should Run
Dashboards are only useful when they map to decisions. These are the core reports the suite should deliver out of the box:
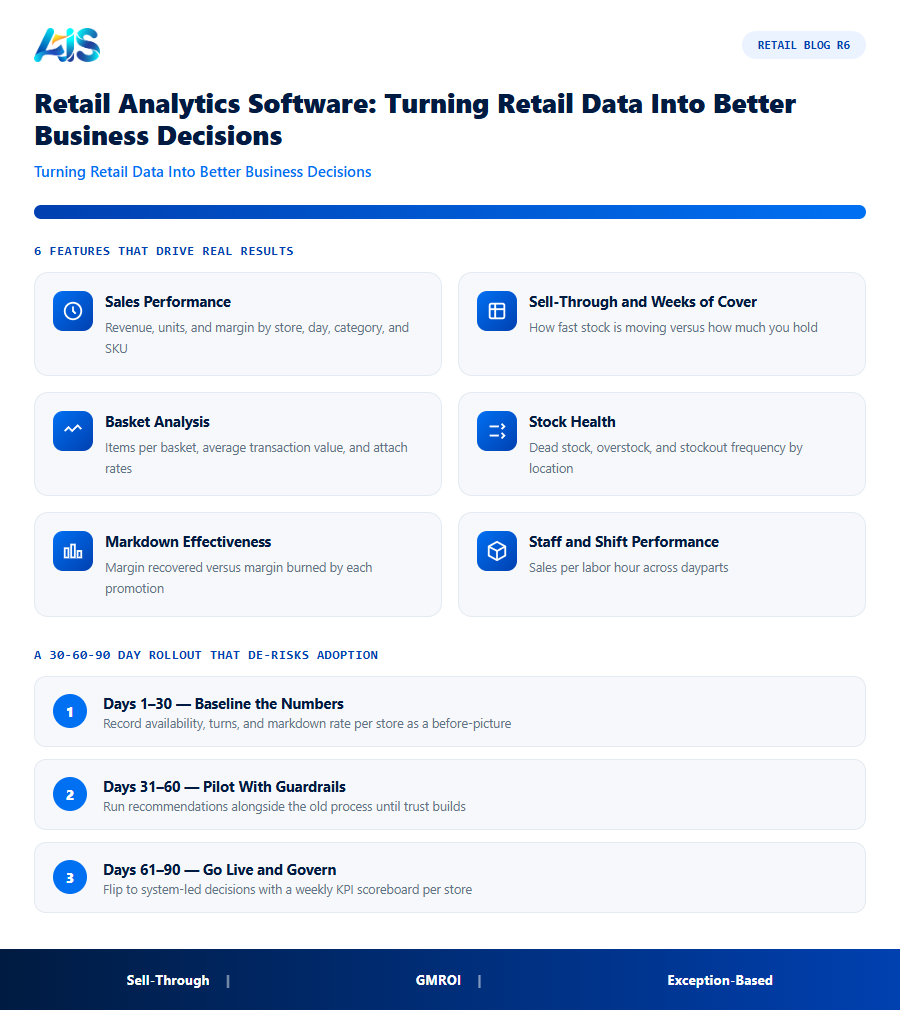
- Sales performance — revenue, units, and margin by store, day, category, and SKU.
- Sell-through and weeks of cover — how fast stock is moving versus how much you hold.
- Basket analysis — items per basket, average transaction value, and attach rates.
- Stock health — dead stock, overstock, and stockout frequency by location.
- Markdown effectiveness — margin recovered versus margin burned by each promotion.
- Staff and shift performance — sales per labor hour across dayparts.
Retail Analytics Software vs Spreadsheets: The Real Difference
Every retailer starts with spreadsheets, and they work — until the number of stores, SKUs, and channels outgrows them. The table below shows where the break usually happens:
| Question | Spreadsheet answer | Retail analytics software answer |
|---|---|---|
| Why did margin drop? | Manual pivot, hours of digging | Exception flagged with root-cause drill-down |
| Which store needs stock? | Guesswork from stale exports | Live sell-through by location, updated per sale |
| What will next week sell? | Gut feel or last year plus 5% | AI forecast per store, category, and SKU |
| Who acts on insight? | Whoever opens the file | Alerts and briefings pushed to each manager |
The deeper difference is trust. When numbers come from one governed source, meetings stop debating whose spreadsheet is right and start deciding what to do — which is the entire point of the suite.
Getting Started With Retail Analytics in 90 Days
You do not need a data team to begin. Connect your POS and ERP, pick five KPIs the leadership team actually uses, and automate a weekly performance briefing. Most retailers see adoption jump when insights arrive as a short summary — by store, with exceptions first — instead of a 40-tab workbook.
From there, layer in AI: anomaly detection for shrinkage and pricing errors, demand forecasts for buying, and a chatbot that answers stock or sales questions in plain language. Each step converts analytics from a reporting chore into a daily operating habit.
For a vendor-neutral view of dashboard best practices, see the Microsoft Power BI guidance on connecting store data to decisions.
Those KPIs feed the same pipeline behind warehouse-to-finance SAP insights..
How the Investment Pays for Itself
The business case for the suite is unusually straightforward because the costs of the status quo are visible every single week — in markdowns, rush orders, overtime, and write-offs. Put numbers on those leaks and the software starts paying for itself.
Then look at working capital. Inventory is usually a retailer’s largest use of cash after property, so a ten to fifteen percent reduction in average holdings — a realistic outcome once the suite is running — releases funds that can pay down debt or fund new ranges. Labour is the third lever: buyers, planners, and store managers reclaim hours previously lost to spreadsheets, stock counts, and expediting.
There is also a compounding effect that spreadsheets understate. Cleaner stock data improves every downstream decision: forecasts get sharper, suppliers perform better against reliable orders, and store teams stop firefighting. Each quarter the system runs, the recommendations get more precise because they learn from more history — the return grows while the subscription cost stays flat.
A 30-60-90 Day Rollout That De-risks Adoption
The safest way to adopt the suite is in waves: prove it in a few stores, harden the process, then scale. A 30-60-90 day plan keeps momentum while giving every stakeholder an early win.
Training is lighter than most teams fear. Store champions need a single hands-on session plus a one-page crib sheet; buyers and planners need half a day on approvals, exceptions, and tuning. Because daily work happens through familiar screens and plain-language alerts, adoption rarely becomes the bottleneck.
- Days 1-30 — baseline the numbers: record availability, turns, and markdown rate per store so the suite has a before-picture to beat.
- Days 31-60 — pilot with guardrails: run system recommendations alongside the old process, overriding only with a logged reason, until trust builds.
- Days 61-90 — go live and govern: flip to system-led decisions, review exceptions weekly, and publish a visible KPI scoreboard per store.
Retail Analytics Metrics Worth Tracking Weekly
Retail analytics software can produce hundreds of reports, but most retailers get the most value from a short list reviewed on a consistent cadence. These are the metrics worth a standing weekly review:
- Sell-through rate by category — the percentage of received stock sold in a given period; it flags slow categories before they become clearance problems.
- Gross margin return on inventory investment (GMROI) — shows which categories generate the most profit per dollar tied up in stock, guiding where to invest open-to-buy budget.
- Basket size and attachment rate — tracks whether promotions and staff training are actually increasing what each customer buys, not just footfall.
- Stock cover by store — weeks of supply on hand at current sales velocity, the earliest warning sign of an approaching stockout or overstock.
- Shrinkage rate by location — sudden changes often point to a process gap or loss issue worth investigating before it compounds.
The value of retail analytics software comes not from the volume of dashboards available but from the discipline of reviewing a small, consistent set of numbers every week and acting on what changes. Retailers who build this habit around five or six core metrics make faster decisions than those drowning in fifty reports nobody has time to read.
Building an Exception-Based Analytics Habit
The failure mode of most retail analytics software rollouts is not lack of data — it is too much of it. A manager who opens forty widgets every morning stops opening the dashboard at all within a few weeks. The retailers who sustain daily use of analytics almost always run an exception-based model instead: the system surfaces only what needs a decision, and everything performing within normal range stays quiet.
In practice, this means configuring thresholds per metric rather than displaying raw numbers for everything. A store that is 3% below its sales target on a normal Tuesday does not need a flag; a store that is 20% below target, or a SKU whose sell-through rate suddenly halves week over week, does. The analytics platform’s job is to do that filtering automatically and push only the outliers to the person who can act on them — a category manager for a margin anomaly, a store manager for a staffing gap, a buyer for a stockout risk.
Retailers who configure exception thresholds thoughtfully during setup see meaningfully higher long-term engagement with their retail analytics software than those who leave every dashboard fully manual.
A Composite Example: Turning a Margin Mystery Into a Fixed Process
A regional homeware retailer — a composite drawn from patterns we see repeatedly — noticed gross margin drifting down over two quarters without an obvious cause. Sales were healthy, headline revenue was on target, and nobody could immediately explain the erosion. The finance team’s monthly report showed the trend but not the reason, because it aggregated all stores and categories into one number.
Once retail analytics software broke the same margin figure down by store and category, the pattern became visible within a single review: three stores were running unauthorized discretionary discounts at the register on a specific furniture category, well above what head office had approved. No single store’s discounting looked dramatic alone, but combined across three locations it had quietly eroded margin. A discount-approval alert, triggered whenever a register discount exceeded a set threshold, closed the gap the following quarter.
The pattern generalizes beyond this example: aggregate numbers hide problems that only become visible once analytics can slice by the dimension where the actual cause lives — store, category, day, or even individual staff member. Retail analytics software earns its value at that granularity, not in the headline dashboard.
Retail analytics software: Frequently Asked Questions
What KPIs matter most in retail analytics software?
Start with sales, gross margin, sell-through rate, weeks of cover, basket size, and stockout frequency. Mature teams add markdown effectiveness and sales per labor hour.
Does retail analytics software need a data warehouse?
Not necessarily. Platforms built on an ERP like SAP Business One analyze live transactional data directly, so small and mid-size retailers get warehouse-grade insight without warehouse infrastructure.
How is AI changing retail analytics?
AI shifts analytics from describing the past to predicting and explaining: forecasting demand, spotting anomalies, and answering natural-language questions like which stores missed target and why.
What data do we need before starting with retail analytics software?
Clean item masters, accurate opening stock per location, supplier lead times, and at least six months of sales history. Most retailers already hold all four inside their POS and ERP — the implementation work is validation and deduplication, typically completed inside the first month.
Can small retail chains afford this kind of platform?
Yes. Cloud pricing scales with stores and users, so a five-store chain pays a fraction of what an enterprise deployment costs. Because the savings come from the same leaks — stockouts, markdowns, overstock — smaller chains often see faster payback in percentage terms.
Does this kind of platform replace our buyers and planners?
No — it upgrades them. the platform handles the repetitive arithmetic of forecasting and ordering so buyers can negotiate better terms, planners can shape ranges, and store teams can serve customers. Headcount rarely falls; output per head rises sharply.
the suite turns the data your stores already generate into faster, better decisions. Choose a platform that covers the core reports, pushes exceptions to the right people, and explains the why behind the numbers — and analytics stops being a month-end ritual and becomes how you run retail every day. The retailers winning in 2026 are not the ones with the most stores — they are the ones whose stock decisions are fastest and most accurate. the suite is how a mid-size chain trades with the discipline of a national one. See how Retail Pro AI brings retail analytics software together with AI inside SAP Business One — book a demo to see your own store data in action.
