


In this guide: retail demand forecasting software explained end to end — what it does, the features that matter, and how to roll it out in your stores.
the forecaster answers the most expensive question in retail: what will each store actually sell, and when? Instead of buying to gut feel and averages, AI models learn the demand pattern of every item in every location — seasonality, promotions, weather, local events, and trend curves — and turn that into purchase-ready numbers.
The payoff is double-sided: fewer stockouts on winners and less cash trapped in losers. This guide explains how AI demand forecasting works, which metrics prove it is working, and how platforms like Retail Pro AI bring forecasting to SAP Business One retailers without rebuilding operations.
Why Spreadsheet Forecasting Fails Multi-Store Retailers
A spreadsheet forecast is usually last year plus a percentage. It cannot see that one store sells twice the chain average of a size, that a promotion pulled demand forward two weeks, or that a local event moved a whole category. Multiplied across hundreds of SKUs and dozens of stores, those blind spots stop cancelling out — they compound.
The cost shows up as inventory distortion: simultaneous stockouts and overstock in the same category. Research shared by the National Retail Federation puts the annual global cost of distortion in the hundreds of billions — most of it traceable to demand nobody predicted.
How Retail Demand Forecasting Software Works
Modern the forecaster runs a repeatable pipeline:
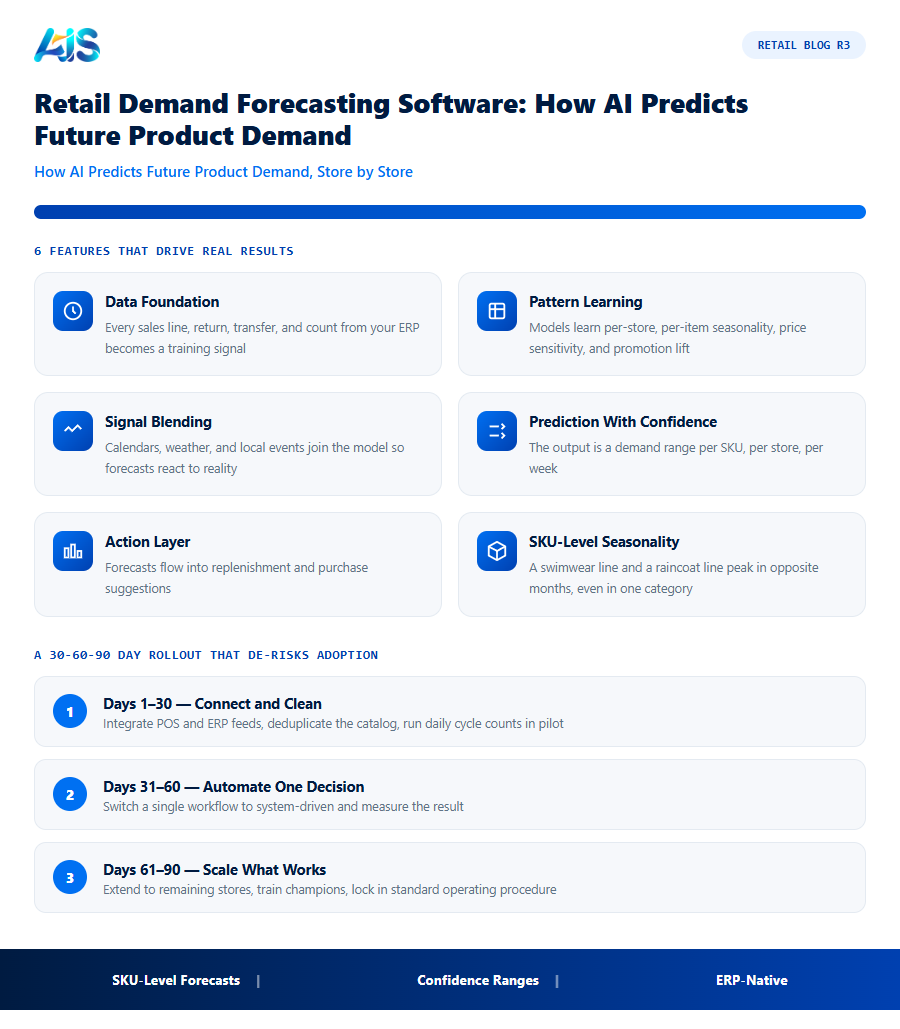
- Data foundation — every sales line, return, transfer, and count from your ERP becomes a training signal.
- Pattern learning — models learn per-store, per-item seasonality, price sensitivity, and promotion lift.
- Signal blending — calendars, weather, and local events join the model so forecasts react to reality.
- Prediction with confidence — the output is a demand range per SKU, per store, per week.
- Action layer — forecasts flow into replenishment and purchase suggestions, so prediction becomes ordering.
Because the pipeline runs on ERP data, forecasts and financials agree. That single source of truth is what separates forecasting software from a dashboard bolted onto exports.
Demand Forecasting in Action: Seasons and Promotions
Consider a 20-store electronics retailer heading into the festive quarter. The model flags that wall-mounted soundbars historically lift 180% in the four pre-holiday weeks — but only in suburban stores; city stores lift 60%. Purchase orders follow the curve instead of one blunt chain-wide buy: suburban stock lands three weeks early, city stock stays lean until office-party week.
When the January sale runs, the same models measure promotion cannibalization — what shoppers traded down from — so next year’s deal list protects margin instead of just moving volume. Spreadsheets can outline these decisions; they cannot compute them at scale.
Measuring Forecast Quality: The Metrics That Matter
Hold any forecasting tool accountable with four numbers:
| Metric | What it tells you | Healthy target |
|---|---|---|
| MAPE | Average size of forecast error | Below 20% at SKU-store-week level |
| Bias | Systematic over- or under-forecasting | Near zero; drift is an early warning |
| Stockout rate | Share of demand lost to empty shelves | Falling quarter over quarter |
| Weeks of cover | Future demand current stock represents | Right-sized per category, not uniform |
Ask vendors to backtest on your own history and show these metrics before and after. Serious platforms welcome the exercise; exports-and-opinion tools avoid it.
See also how retailers run multi-branch retail operations without exports..
How the Investment Pays for Itself
Finance teams rarely approve the forecaster on features alone — they approve it on payback. The good news is that payback usually arrives from three directions at once: recovered margin, released working capital, and saved labour hours.
Start with availability. Every percentage point of lost sales recovered through better fill rates drops almost entirely to contribution margin, because the rent and wages are already paid. Add the markdown avoided when slow sellers are spotted early, and the cash freed when safety buffers can finally be trimmed. A pilot across a handful of stores, measured over eight to twelve weeks, gives leadership credible numbers to approve a full rollout of the forecaster.
Beyond the headline numbers, consider risk. Stockouts during peak season do lasting damage — shoppers who bounce to a competitor rarely return, and marketplace algorithms punish sellers with cancelled orders. A modest improvement in availability protects both revenue and reputation, which is why finance teams increasingly treat inventory accuracy as a revenue-protection investment rather than an operations cost.
A 30-60-90 Day Rollout That De-risks Adoption
Rolling out the forecaster does not need to be a big-bang project. The retailers who succeed fastest follow a tight 30-60-90 day cadence that delivers value early and de-risks each next step.
Governance keeps the rollout honest. Assign one owner per KPI, review exceptions in the existing weekly trading meeting, and require a logged reason for every manual override. Within two cycles the override rate usually collapses — the clearest signal the organisation now trusts its own data.
- Days 1-30 — connect and clean: integrate POS and ERP feeds into the forecaster, deduplicate the catalog, and run daily cycle counts in pilot stores.
- Days 31-60 — automate one decision: switch a single workflow (replenishment, allocation, or approvals) from manual to system-driven and measure the KPI delta.
- Days 61-90 — scale what works: extend to remaining stores, train champions in each location, and lock the new process into standard operating procedures.
What Makes a Demand Forecast Accurate
Not every forecasting model is worth trusting. Before relying on retail demand forecasting software for purchasing decisions, check that it accounts for the factors that actually move demand:
- Seasonality at the SKU level, not the category level — a swimwear line and a raincoat line inside the same apparel category peak in opposite months; category-level forecasts blur both.
- Promotional uplift and cannibalization — a discount on one product often steals sales from a similar product; good forecasting models net this out instead of double-counting demand.
- External signals — local events, weather patterns, and holiday calendars shift demand in ways pure historical averages miss; AI models trained on external data pick these patterns up automatically.
- New product and no-history items — forecasting a brand-new SKU by borrowing the demand curve of a similar existing product, rather than starting from zero history.
A useful accuracy test before you commit to a platform: ask the vendor to forecast a past six-month period using only the data you had at the time, then compare the forecast against what actually happened. Mean absolute percentage error (MAPE) in the 15-25% range is typical for a mature retail demand forecasting deployment; anything claiming near-perfect accuracy on noisy retail data should be treated with caution.
What Data Retail Demand Forecasting Software Actually Needs
Vendors often gloss over data requirements until the implementation is underway, which is when surprises get expensive. Before selecting retail demand forecasting software, confirm the platform can access these inputs directly from your systems rather than through manual export:
- Transaction-level sales history — not daily totals, but line-item detail including store, SKU, quantity, price, and whether the sale was promotional. Aggregated totals hide the promotional lift a model needs to isolate.
- Store and item master attributes — store size, format, and region; item category, size, color, and supplier. Models use these attributes to forecast new items and new stores that lack their own sales history yet.
- Stockout flags — a day where a SKU sold zero units because it was out of stock looks identical to a day of genuinely zero demand unless the system records the stockout separately. Forecasting software that cannot distinguish the two systematically underestimates true demand for chronically understocked items.
- Promotion and pricing calendars — planned future promotions, not just historical ones, so the forecast reflects what is about to happen, not only what already happened.
Retailers running SAP Business One usually already capture all four inside the ERP; the practical work is confirming the forecasting platform reads them natively rather than requiring a separate data warehouse project before it can generate a single useful prediction.
Statistical Models vs. Machine Learning: What Powers the Forecast
Not every product marketed as “AI forecasting” uses the same underlying method, and the difference affects which retailers get the most value:
- Statistical models (moving averages, exponential smoothing) work well for stable, high-volume SKUs with a long clean history and few external disruptions — think staple grocery items or core apparel basics.
- Machine learning models (gradient boosting, neural networks) earn their keep on volatile, promotion-heavy, or seasonal categories where many interacting factors — price, weather, local events, cannibalization — move demand simultaneously in ways a simple trend line cannot capture.
The best retail demand forecasting software does not force a single method across the entire catalog. It automatically routes stable SKUs to lighter statistical models and reserves machine learning for the categories where the added complexity actually improves accuracy — keeping forecasts both fast to compute and easy to explain when a buyer asks why the system recommended a particular order quantity.
Retail demand forecasting software: Frequently Asked Questions
How much history does retail demand forecasting software need?
Useful forecasts typically emerge from 12 months of transaction history, improving through a second seasonal cycle. New items borrow similarity from comparable products, so launches are covered too.
Does AI forecasting replace planners?
No — it removes the arithmetic so planners can judge exceptions: new ranges, range reviews, supplier changes. Teams decide; the software counts.
Can it work with SAP Business One?
Yes. Platforms like Retail Pro AI read SAP Business One directly, so forecasts, stock, and purchase orders stay in one ERP database without exports.
How does retail demand forecasting software integrate with SAP Business One?
Through a native connector, retail demand forecasting software reads items, warehouses, purchase orders, and sales history directly from SAP Business One and writes back approved transactions — no re-keying, no nightly batch files. Platforms such as Retail Pro AI are built specifically for this integration, so stock, purchasing, and finance stay in one consistent database.
How is this kind of platform different from our POS reports?
POS reports describe what already happened; the platform decides what should happen next. It forecasts demand, generates orders and transfers, flags exceptions, and explains its reasoning — moving teams from backward-looking reports to forward-looking decisions.
How long until we see ROI from this kind of platform?
Dashboard and alert value appears in weeks; measurable KPI movement — availability up, markdowns down — typically shows within one quarter on pilot stores. Full payback inside twelve months is the benchmark to hold vendors to, and most well-run rollouts beat it.
the forecaster turns demand from a guess into a plan. Anchor it to your ERP, measure it with MAPE, bias, stockouts, and cover, and let the forecast drive purchasing automatically. Retailers who forecast well stop paying for stock they do not need — and stop missing sales they already earned. Every week without the forecaster is another week of preventable stockouts and markdowns. A focused pilot costs little, proves much, and gives your board the evidence to back a full rollout. See how Retail Pro AI brings retail demand forecasting software together with AI inside SAP Business One — book a demo to see your own store data in action.
